Guinier analysis
Recall Guinier’s approximation at low-q: \(I(q)\approx I(0) \exp(-R_g^2 q^2 /3)\).
Rg and I(0) can be determined by performing a linear fit in the Guinier plot (a plot of \(\ln(I)\) vs. \(q^2\)). The fitting region should normally have \(q_{max}R_g<1.3\) for globular proteins. This fitting region is called the “Guinier region.”
In RAW, right click (ctrl click on macs without a right mouse button) on the subtracted GI scattering profile in the Manipulation list and select “Guinier fit”. In the plots on the right, the top plot shows you the Guinier plot and the fit, while the bottom plot shows you the residual of the fit.
- Note: RAW automatically tries to find the best Guinier region for you when the Guinier window is opened for the first time.
- Note: The Rg value is in units of 1/q (e.g. if q is in Å-1 then Rg is in Å), while the two \(qR_g\) boxes give, left to right, \(q_{min}R_g\) and \(q_{max}R_g\) respectively.
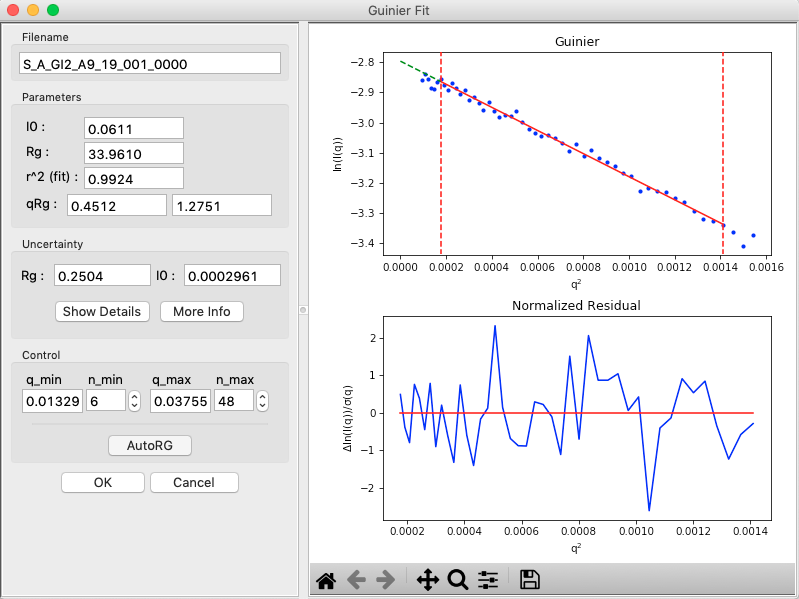
In the “Control” panel, you’ll see that n_min is now 6. This means RAW has cut off the first six points of the scattering profile in the fit. Use the arrow buttons next to the n_min box to adjust that to zero. Check whether the Rg changes.
In the “Parameters” panel, note that \(q_{max}R_g\) is only ~1.27. Recall that for globular proteins like GI, it is typical to have \(q_{max}R_g\) ~1.3. Adjust n_max until that is the case, watching what happens to the Rg and the residual.
- Question: The literature radius of gyration for GI is 32.7 Å. How does yours compare?
RAW also provides an estimate of the uncertainty in both the Rg and I(0) values for the Guinier fit, shown in the Uncertainty section.
- Note: This is the largest of the uncertainties from the fit (standard deviation of fit values calculated from the covariance matrix), and either the standard deviation of Rg and I(0) across all acceptable intervals found by the autorg function or an estimated uncertainty in Rg and I(0) based on variation of the selected interval start and end points.
Click the “OK” button to keep the results.
- Checkpoint: If you now select the GI scattering profile, in the information panel at the top you should see the Rg and I(0) that you just found.
- Note: Clicking the “Cancel” button will discard the results.
Repeat the Guinier analysis for lysozyme.
- Try: Increase qmin and/or decrease qmax to verify that the Rg does not change significantly in the Guinier region.
- Tip: If you hover your mouse cursor over the info icon (just left of the target icon) for a given scattering profile it should show you the Rg and I(0) of your Guinier analysis.
Aside: Criteria for a good Guinier region
For a globular protein, you are looking for three essential components in your Guinier fit:
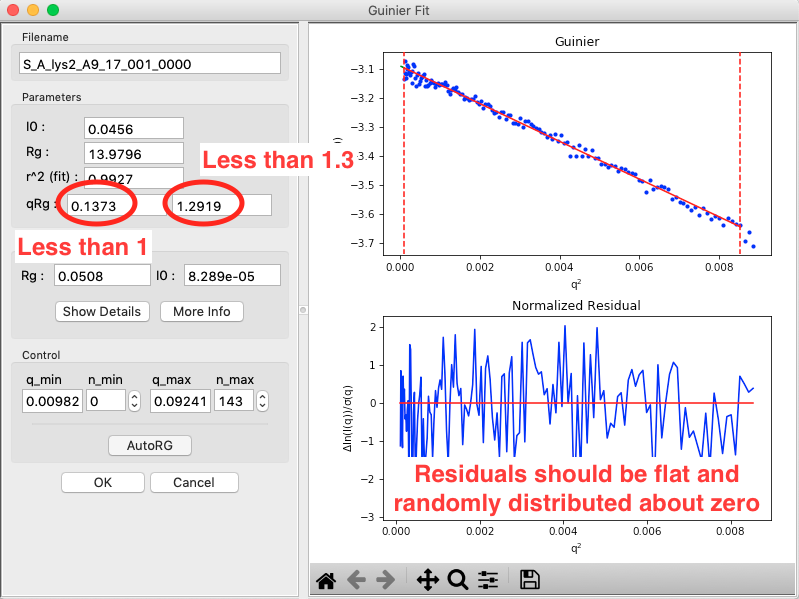
- \(q_{min}R_g<1.0\). This states that the minimum q of your fit, qmin, times the Rg of your fit should be less than 1.0. This criteria ensures you have enough q range to properly estimate the Rg and I(0) values.
- \(q_{max}R_g<1.3\). This states that the maximum q of your fit, qmax, times the Rg of your fit should be less than 1.3. This criteria ensures you remain in the linear range of the Guinier approximation for the fit.
- Residuals should be flat and randomly distributed about zero. If your residuals have a ‘smile’ (above zero near start and end of fit, below in the middle), or a ‘frown’ (below zero near start and end of fit, above in the middle), it indicates you have non-ideal data. The ‘smile’ is characteristic of aggregation, the ‘frown’ characteristic of interparticle repulsion.
Additionally, you shouldn’t have to excluded very many points at the start of the fit. A few is generally fine, as the points nearest the beamstop can be noisy (depending on the exact details of the measurement). If you have a small amount of aggregation or repulsion it may manifest as a small upturn or downturn at low q that, once excluded, doesn’t seem to affect the fit residual (i.e. no ‘smile’ or ‘frown’). In these cases, you may proceed, but exercise caution as your data may be subtly affected. Also, be sure whoever you present the data to understands you observed these effects and decided to proceed with analysis despite the non-ideality.
Note that for non-globular systems, such as rod-like shapes, the fitting range shifts as the linear region of the Guinier approximation shifts.