Guinier analysis
This tutorial covers how to use RAW for Guinier analysis. This is not a tutorial on basic principles and best practices for doing a Guinier analysis. For that, please see the SAXS tutorial.
A video version of this tutorial is available:
The written version of the tutorial follows.
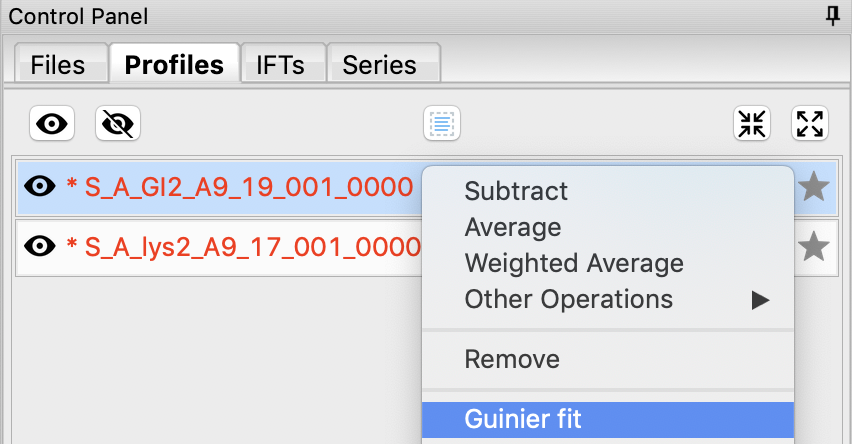
In RAW, right click (ctrl click on macs without a right mouse button) on the subtracted GI scattering profile in the Profiles list and select “Guinier fit”. The Guinier fit window will open.
- Note: You can also click the ‘Guinier’ button at the bottom of the Profiles control panel.
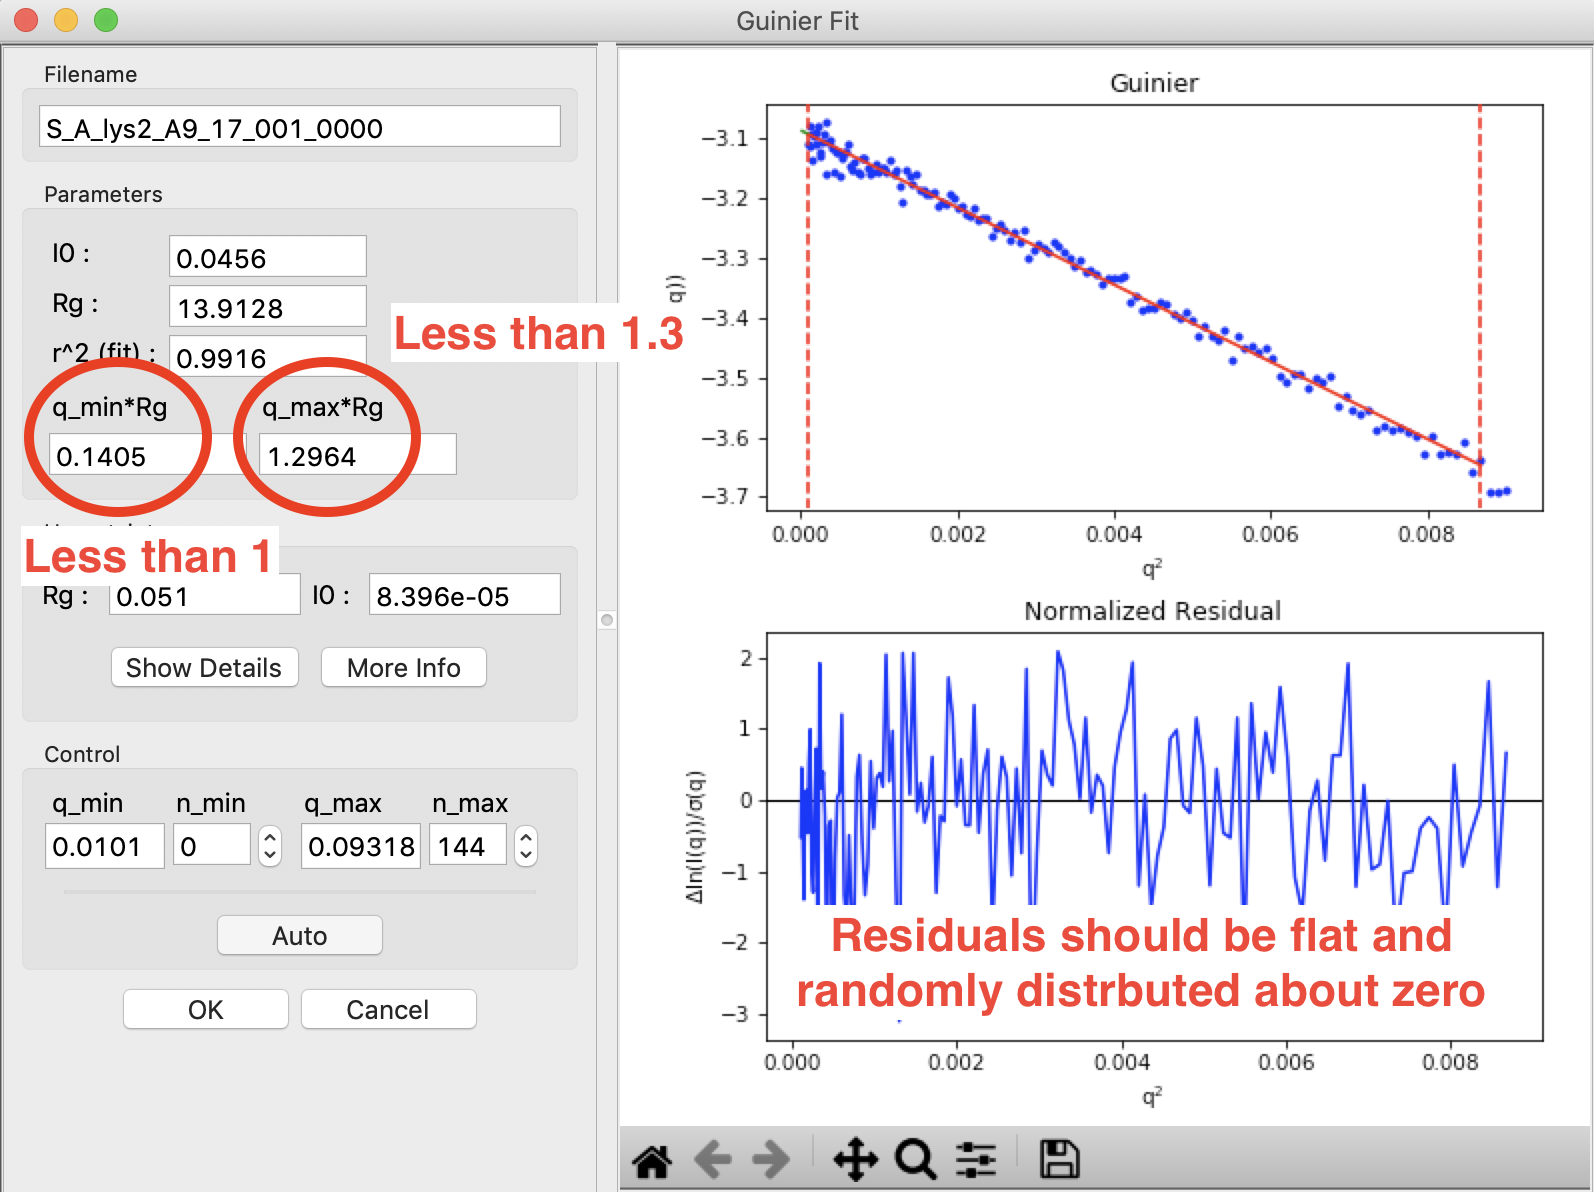
In the Guinier window, the top plot shows you the Guinier plot and the fit, while the bottom plot shows you the residual of the fit.
- Note: RAW automatically tries to find the best Guinier region for you when the Guinier window is opened for the first time.
- Note: The Rg value is in units of 1/q (e.g. if q is in Å-1 then Rg is in Å).

In the “Control” panel, you’ll see that n_min is 0. This means RAW has used all of the low q for the Guinier fit. You can see a little dip in the residual at the lowest q values, use the arrow buttons next to the n_min box to adjust it up several points to remove that dip and check whether the Rg changes. Once you’re done return n_min to 0.
In the “Parameters” panel, note that \(q_{max}R_g\) is only ~1.14. Recall that for globular proteins like GI, it is typical to have \(q_{max}R_g\) ~1.3. Adjust n_max until that is the case, watching what happens to the Rg and the residual.
- Question: The literature radius of gyration for GI is 32.7 Å. How does yours compare?
RAW also provides an estimate of the uncertainty in both the Rg and I(0) values for the Guinier fit, shown in the Uncertainty section.
- Note: This is the largest of the uncertainties from the fit (standard deviation of fit values calculated from the covariance matrix), and either the standard deviation of Rg and I(0) across all acceptable intervals found by the autorg function or an estimated uncertainty in Rg and I(0) based on variation of the selected interval start and end points.
Click the “OK” button to keep the results.
- Note: Clicking the “Cancel” button will discard the results.
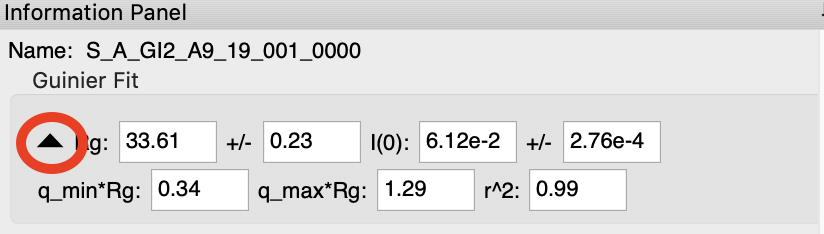
If you now select the GI scattering profile, in the information panel above the control panel you should see the Rg and I(0) that you just found.
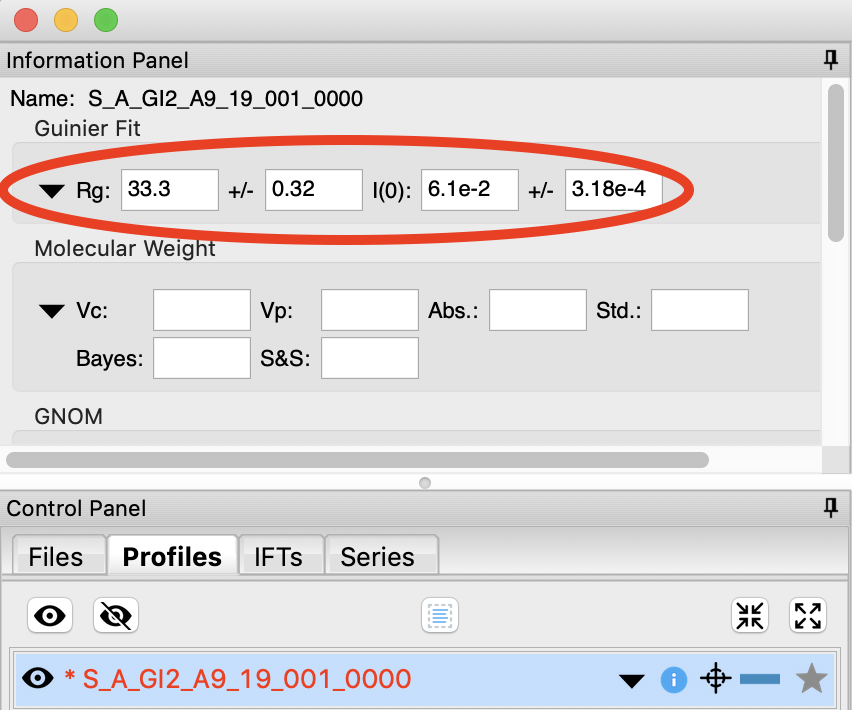
- Tip: Click on the triangle to expand the Guinier info section and see more details on the fit.
Repeat the Guinier analysis for lysozyme.
- Try: Increase qmin and/or decrease qmax to verify that the Rg does not change significantly in the Guinier region.
- Tip: If you hover your mouse cursor over the info icon (just left of the target icon) for a given scattering profile it should show you the Rg and I(0) of your Guinier analysis.