Pair-distance distribution analysis – BIFT in RAW
RAW also has a built in method for determining the P(r) function using a Bayesian IFT method. This has the advantage of only have one possible solution. More information on this method can be found in the RAW paper and manual and references therein.
Right click on the lysozyme profile in the Manipulation list you loaded previously. Select “IFT (BIFT)” from the resulting menu.
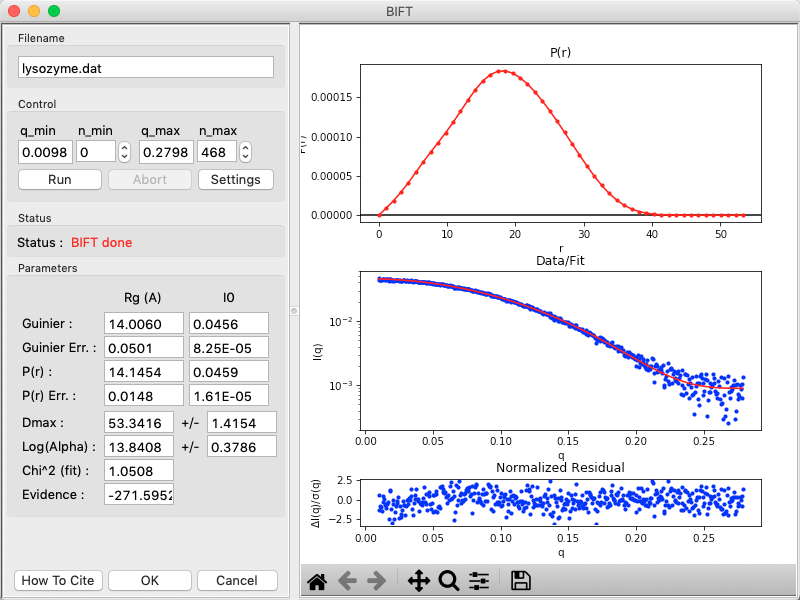
The BIFT panel has plots on the right. These show the P(r) function (top panel), the data (middle panel, blue points) and the fit line (middle panel, red line), and the fit residual (bottom panel).
On the left of the BIFT panel are the controls and the resulting parameters. Note that in this case you do not control the Dmax value, the BIFT method finds that for you automatically. Because BIFT can take some time to run, if you change the q range for the data set you have to click the ‘Run’ button to run BIFT again.
Note that for this dataset, BIFT has overestimated the Dmax value, however by looking at the P(r) function you can quickly see that the true Dmax is somewhere near 40, in good agreement with what we got from GNOM.
Click OK to exit the BIFT window. This saves the results into the RAW IFT panel.
Click on the IFT Control and Plot tabs. This will display the BIFT output you just generated. Save the lysozyme.ift item in the reconstruction_data folder.
Note: As of now, BIFT output from RAW is not compatible with DAMMIF or other ATSAS programs. However, it is compatible with electron density determination via DENSS.